A few years ago, I was working with equirectangular projections of spherical data (mostly spherical panoramas and spherical depth maps) for a 3D reconstruction research project. For a reason I can’t remember, I started wondering what a great circle would look like in an equirectangular projection. A great circle is the intersection between a plane and a sphere if the plane intersects the center of the sphere.
To get a quick answer, I drew a rough sketch of a great circle on a sphere. On the sphere, I marked the meridians and parallels at 45° intervals. Then, I sampled the great circle where it intersects with the meridians and parallels and mapped those points on an equirectangular map. Finally, I drew a curve between the sampled points to get the results shown in figure 1.
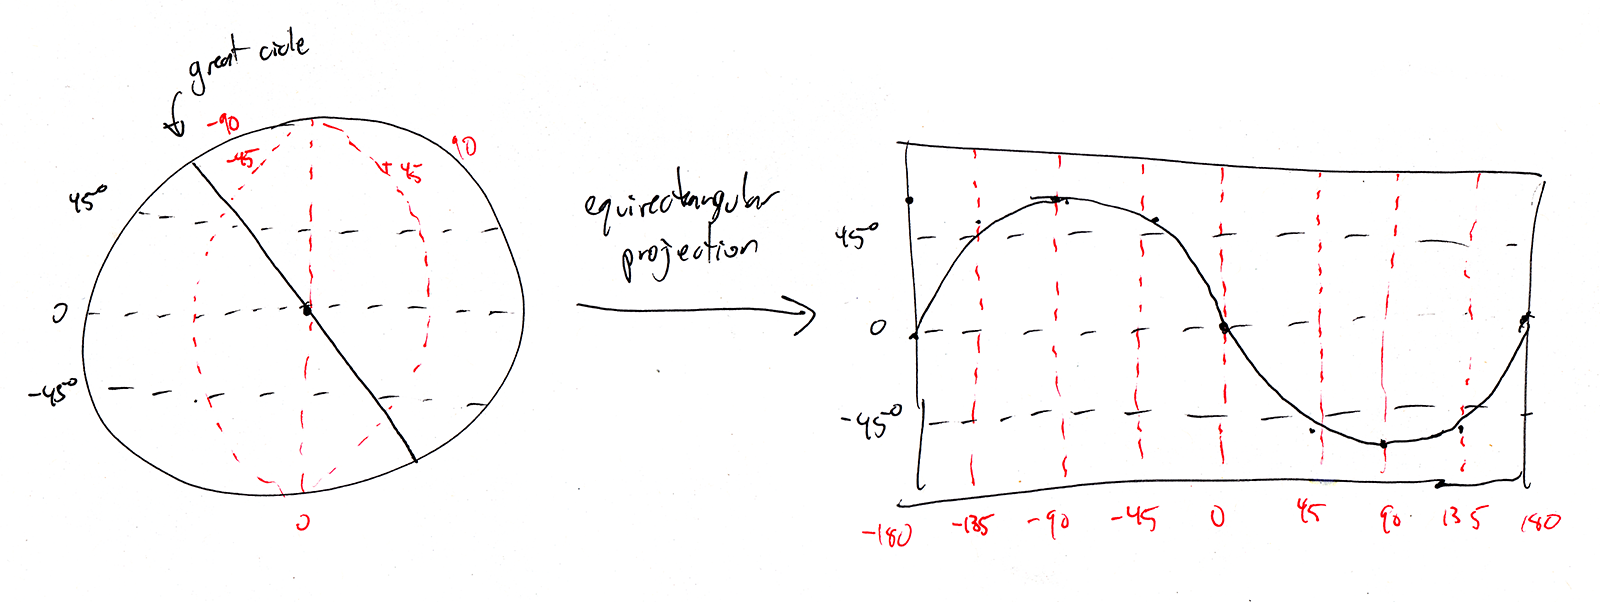
That’s nice, I have my answer : the equirectangular projection of a great circle is a sine wave. But I wasn’t fully satisfied, I felt the complete answer was more complex.
The inclination (angle between the great circle plane and the equator plane) of the great circle I sampled was midway between the equator and a meridian (great circle passing by the poles). It’s always interesting to think about the edge cases to understand a phenomenon. What if it passes by the poles or is parallel with the equator? The simplest case to visualize is when the great circle is on the equator. It this case, the projection is simply a straight line on the equator in the equirectangular projection.
When the great circle passes by the poles, things get interesting. In this case, the great circle passes by two meridians located 180° apart longitudinally. In our example, the great circle passes by the meridians at 0° and 180°. This translates into vertical lines at longitudes 0° and 180° on the equirectangular projection. Also, the poles are singular points in spherical coordinates. By definition, we can say that a pole is a valid point at any longitude. This means we can draw a horizontal line at latitudes 90° and -90° in the equirectangular projection since the great circle passes by the poles. The figure below shows an equirectangular projection of these two edge cases and roughly interpolated projections of great circles between these two edge cases.
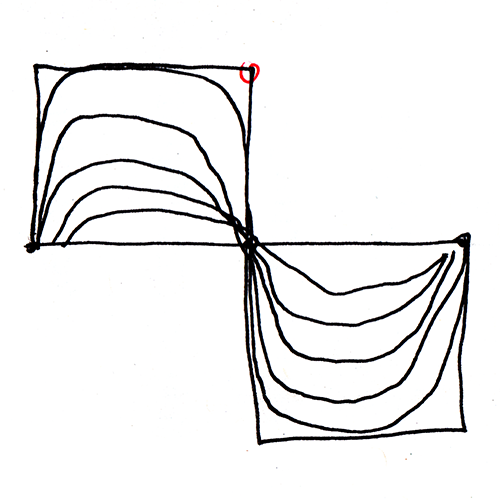
If this sketch is accurate, this means that when the great circle inclination is small, the equirectangular projection can be approximated by a sine wave. As the inclination increases, the sine wave gets increasingly distorted. The top of the curve gets flatter and it gets closer to a square wave.
That sketch satisfied my curiosity at the time. This week, when searching through old notes, I came across the sketch and decided to investigate the subject a little more. I wrote a small Python program to simulate different great circles and project them on equirectangular maps. The results are presented in figure 3. Each curve represents a great circle at a different inclination (angle between the plane of the great circle and the equator plane).
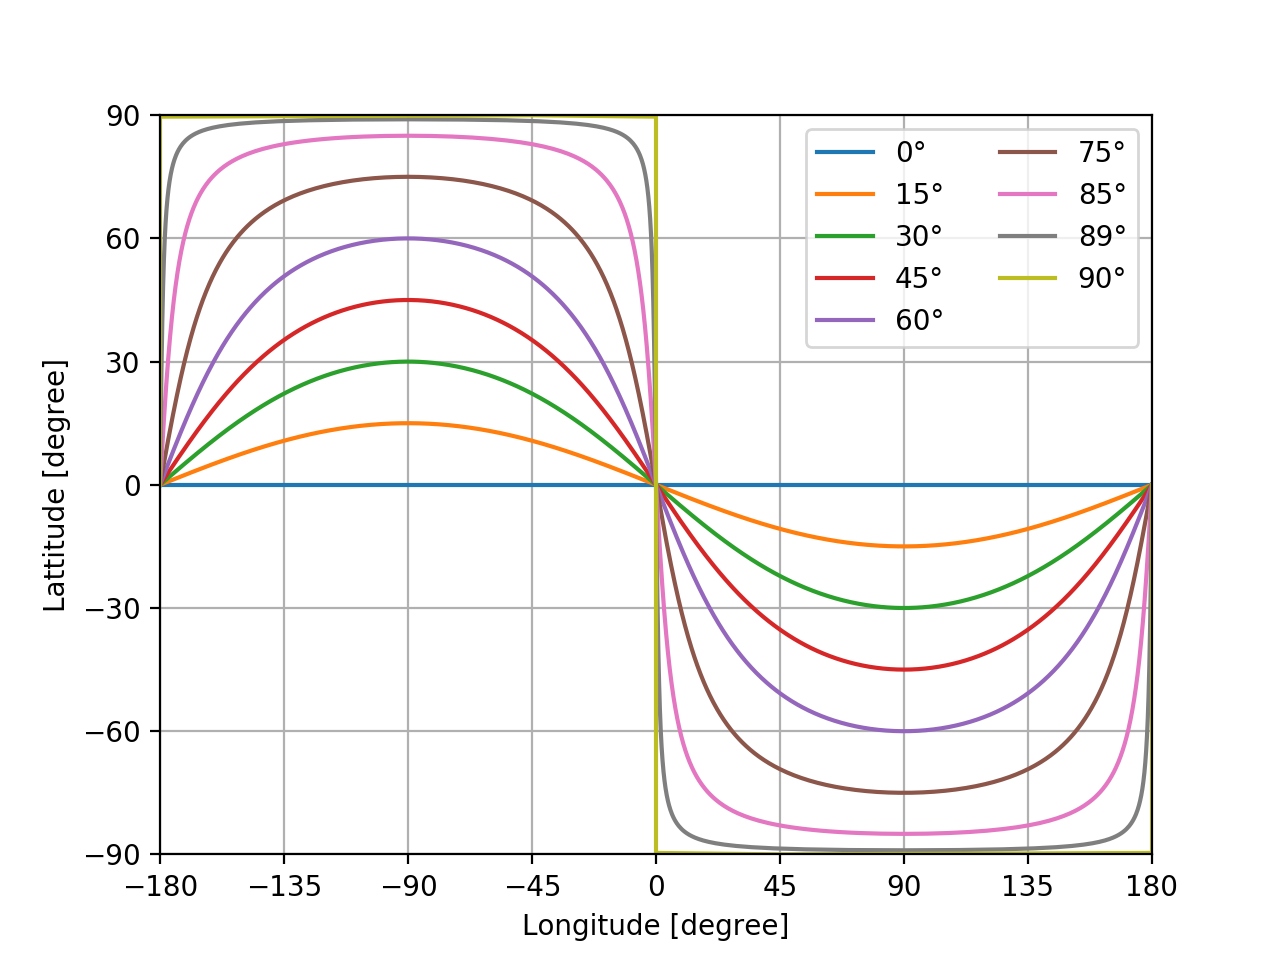
The simulations confirm the conclusions I obtained with the rough sketch. The equirectangular projection of great circles looks like a sine wave when the inclination is small. The sine wave gets more distorted as the inclination increases, with the curve looking more like a square wave. This behavior is not special to great circles, it has more to do with the equirectangular projection that heavily distorts points near the poles.
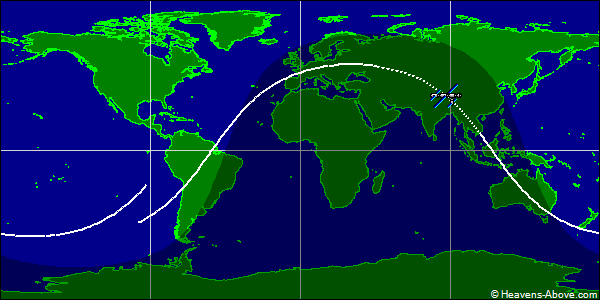
Because of its simplicity, the equirectangular projection is used quite often in our everyday lives to display maps of planet Earth. For example, the shape of the curves we just discovered explains the shape of satellites’ trajectories we often see displayed in the media or movies. Indeed, the trajectory of circular orbiting satellite around the planet will look like a curve similar to the ones in Figure 3 when displayed on an equirectangular projection map of the planet. For example, the International Space Station has a spherical orbit and its trajectory on an equirectangular map looks like this :